[FREE] fx:macro Lite / 05.11.23
Hi there! It's already Sunday, so it's time for another edition of fx:macro Lite! Great to have you here!
When I asked MidJourney for a cover image for this issue, I put in the prompt: “What breadth looks like in the stock market”. The results look weird but some things came up again and again: rain, people with umbrellas, and parts of Greek temples or pyramids.
This week, I write about how I approach market breadth and why it's valuable. And in a sense, MidJourney captures quite a few relevant concepts in its images. You can read more about that below.
 |
Let's get started…
In case you missed the usual deep-dive yesterday, you can still sign up for that here and get access to the premium content:
💎 Three central banks and three PMIs
In a sense, reading “old” central bank statements and comparing what they said this time around to what they said before, feels like reading yesterday’s newspaper. But I think it’s just basic homework for everyone who’s seriously trading currencies. This week, homework means: Fed, Bank of England and BOJ.
fxm-2023-W45-04Nov-1-REVIEW.pdf
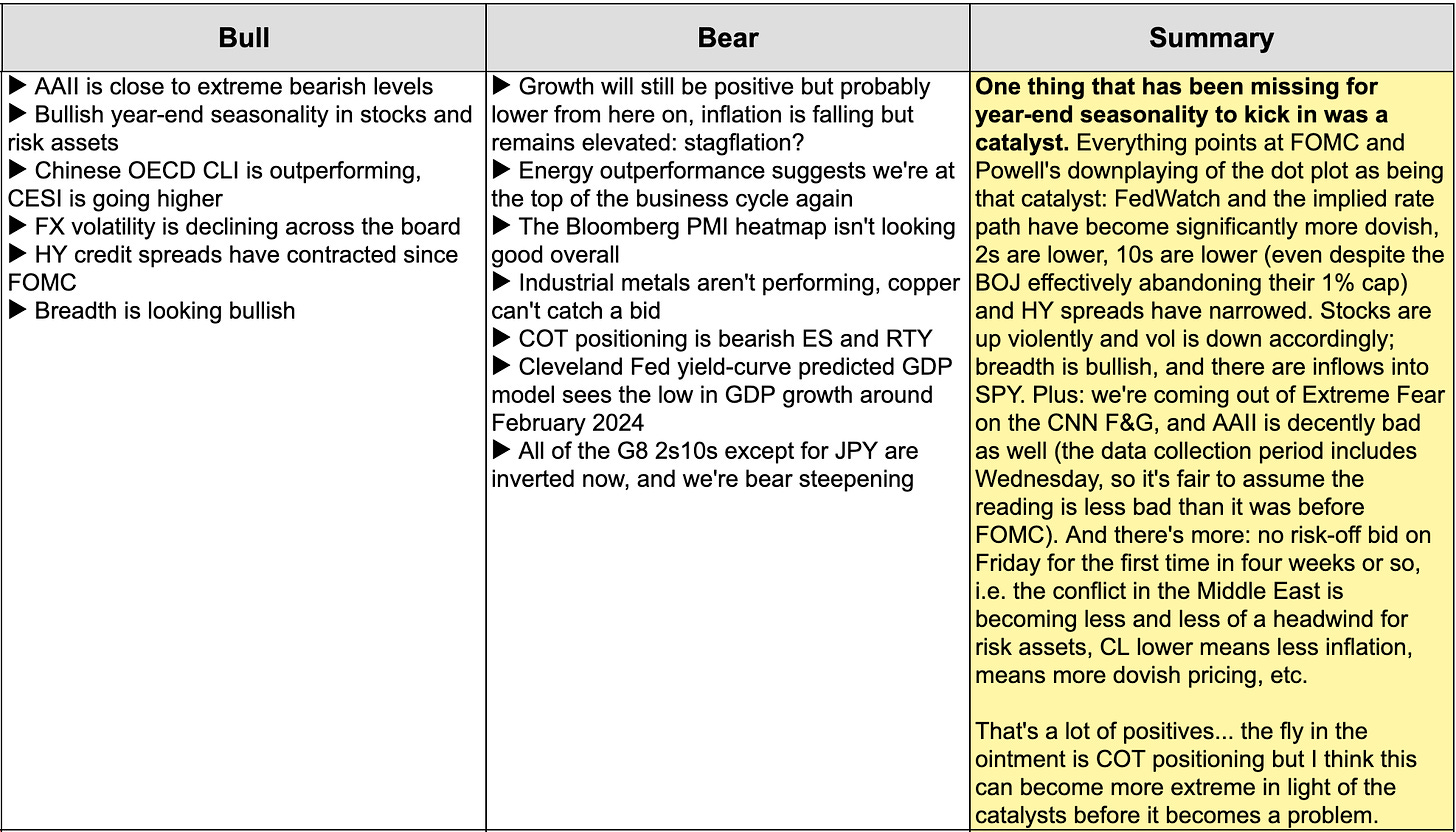
🎄 What about year-end seasonality?
Here’s what I think from this week’s issue of fx:macro Premium
 |
💡 Market Breadth
I guess most of you are familiar with the basic idea of market breadth. If not, here's a quick explainer from ChatGPT:
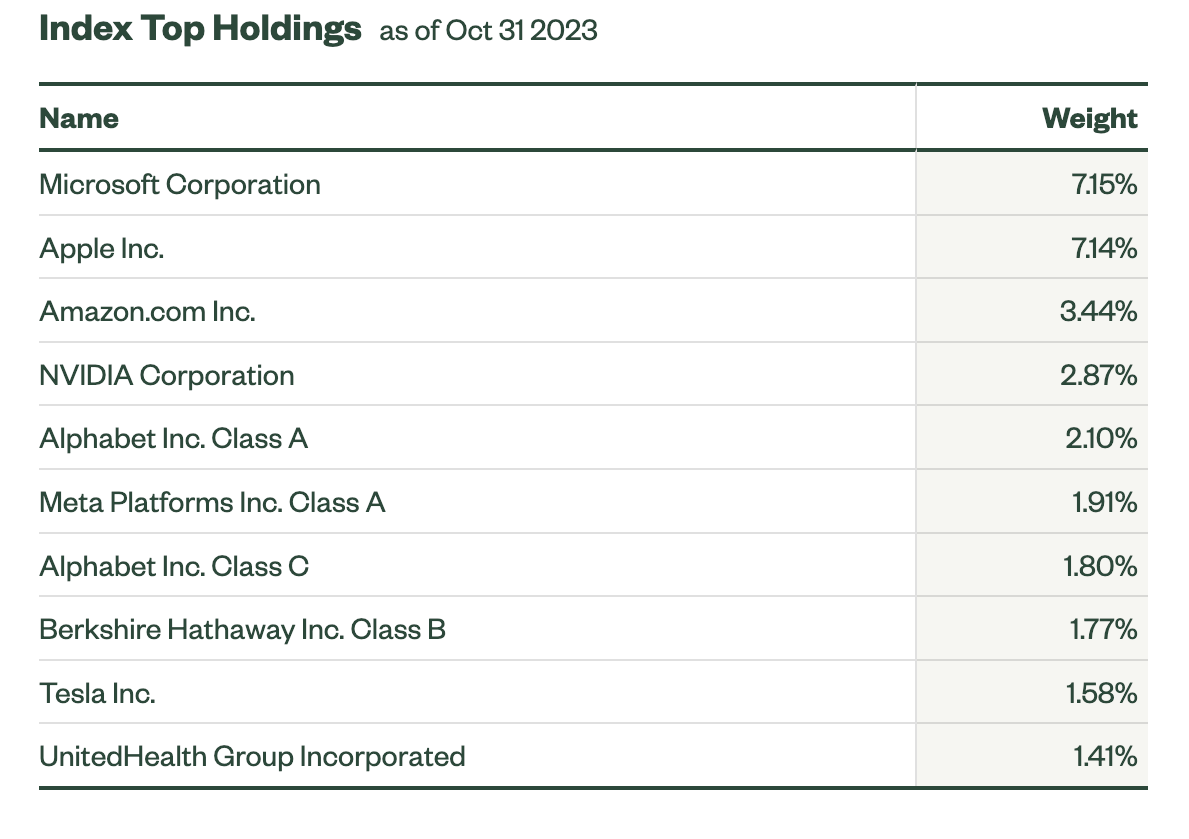
The S&P 500 is capitalization-weighted, so a small number of companies have a disproportionally large influence on the movement of the entire index. MSFT, AAPL, AMZN and NVDA alone make up 20% of the entire S&P 500. That's nothing new but it's always a good reminder…
 |
Market breadth removes that bias as it gives each stock the same weight. Here's what that looks like when we compare the SPY with the equal-weighted RSP. Not much of a difference in how they trade overall, and they're taking turns in which one outperforms the other.
It's not the go-to indicator I'm looking at because it essentially tells you how small(er) large caps perform vs. a few mega caps.
📊 The Classic - Advance/Decline Line
Another popular indicator (and one of my favourites) is the advance/decline line. It looks at how many stocks are up vs. how many stocks are down and takes a cumulative sum of the difference:
Things get interesting when there's a divergence going on. Here are two examples:
Right at the beginning of 2022, the SPX made a final push higher but the A/D line put in a lower high at this point. A few months later, the SPX made a new low but the A/D line wasn't following and made a higher low. There are a lot more examples of relevant market tops that were preceded by the A/D line warning you beforehand, here's September/October 2018:
It's almost as if it hands you an umbrella when it's about to start raining (thanks, MidJourney!).
As always, it's not 100% perfect:
-
You can find plenty of market tops where breadth did not ring the alarm, so:
- A market going up together with its A/D line, or
- A market going down with the A/D line going down as well isn't very interesting from a breadth perspective, and breadth is not “supporting” the market… it just does what it normally does.
-
On the other hand:
- A market going higher with the A/D line declining, or
- A market falling with the A/D line going up are both times to pay close attention.
Usual disclaimer here: it's not a 100% sure thing. Just look at the most recent example from around June-July this year: the A.I. mania was in full force and a few tech stocks pulled up the S&P while the A/D line initially didn't follow.
So, don't treat it as a religion (H/T the Greek temple from MidJourney). But if you go back, you'll find a lot more examples of it working than not.
😱 The Panic Indicator - Stocks above their 50 DMA
Another indicator I follow closely is the number of stocks above their 50-day moving average. Here's what it looks like for the Nasdaq 100:
 |
That's a nice way to look out for market bottoms: when only around 10% or fewer stocks are trading above their 50 DMA then it's often a good time to start paying attention. I've marked three occasions in the chart above:
- March 2020: The reading almost reached zero, and it remained low for a month or so.
- March 2021: A relatively small market correction, the indicator did not reach the 10% mark but the -2 SD band I put around it.
- October 2022: the most recent market bottom with a reading of almost zero again.
Since it's impossible to know how long the indicator can stay depressed, it's impossible to catch the exact low. I tend to look at it on its way up again: as soon as it reaches the 50% mark or the -1 SD band, a bottom is probably in place.
The number of available indicators is endless… New Highs vs. New Lows, Advancing vs. Declining Volume, McClellan Oscillator and so on. I tend to stick with the two I showed above but that's just personal preference.
Good signals don't come often no matter which indicator you choose. The A/D line can go a year or longer without giving you any useful information, and if you look at the last screenshot above, you can see that meaningful downside spikes in the number of stocks above their 50 DMA aren't that frequent either. That's why it pays to have a routine in place where you look at the same charts over and over again.
Let me know what you think!
Until next weekend
FXMG
fx:macro
Join 5,000+ readers and sign up for the free newsletter!
Hi there! It's already Sunday, so it's time for… an announcement! TL;DR: This is going to be the last newsletter for a while. You don't need to do anything, I'll probably be back but I don't know when, and I will neither sell your email address nor send you spam in the meantime. I've been writing fx:macro for about 20 months now, and it has grown into something I'm proud of. As I've often said: it helped me in a lot of ways to become more structured and more concise, I've met great people...
Hi there! It's already Sunday, so it's time for another edition of fx:macro Lite! Great to have you here! This week's image shows a cesspool with a gold nugget in it. Which has a lot to do with the last bit of homework I do every day. Read more about that below… Let's get started… In case you missed the usual deep-dive yesterday, you can still sign up for that here and get access to the premium content: 💎 Central Bank Speaker Recap for this week Speaking of homework… here's this week's...
FX:MACRO - Week 49/2023
Welcome to issue #84 of fx:macro! Summary Research folder with all material: Google Drive The archive will all previous issues can be found here: https://fxmacro.ck.page/ Playbook for next week This is the shortest possible summary of everything you will find in the rest of this newsletter. Please check out this article about what this summary aims to provide and what its limitations are. Currency Drivers For an explanation check out this link. Week in Review Central bank speaker recap for...